Markets, sessions and setups
Start narrow. Pick two to four markets you can follow closely, for example EUR/USD, gold and one stock index. Write down the session and hours you will trade, such as the London morning from 08:00 to 11:00 London time, and stick to them. A fixed window keeps you from trading tired, bored or distracted.
Next, define your setup: the specific situation you trade. Write it precisely enough that another trader could find the same trades on the same chart. A vague rule such as buy when it looks strong cannot be tested. A precise one can:
- D1 shows higher highs and higher lows.
- Price pulls back into a support zone marked on H1.
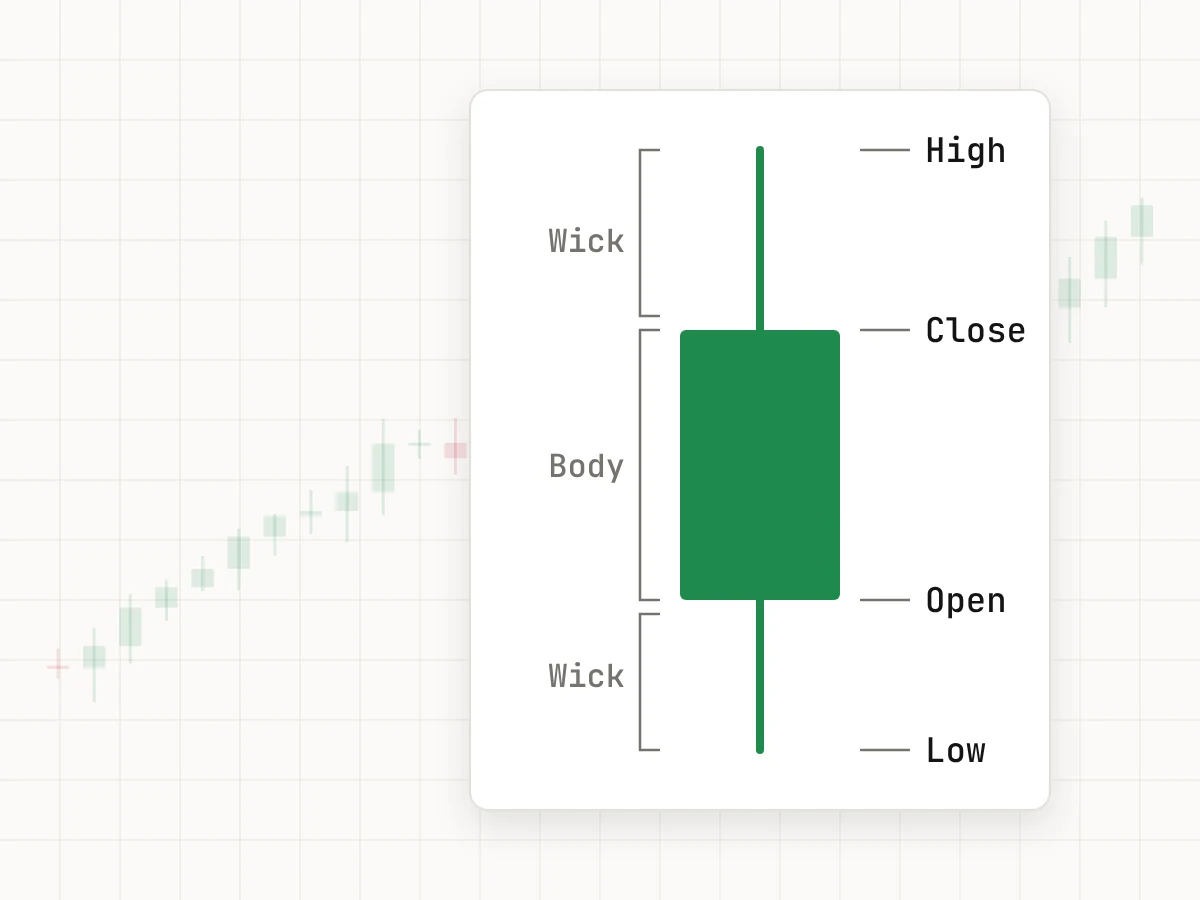
- An H1 candle closes back above the zone with a long lower wick.
If you are unsure how to define trends, zones or candles, the course How to read price charts covers each of them.
Entry, stop and target rules
For each setup, write one rule for each part of the trade:
- Entry: for example, a market order at the close of the signal candle.
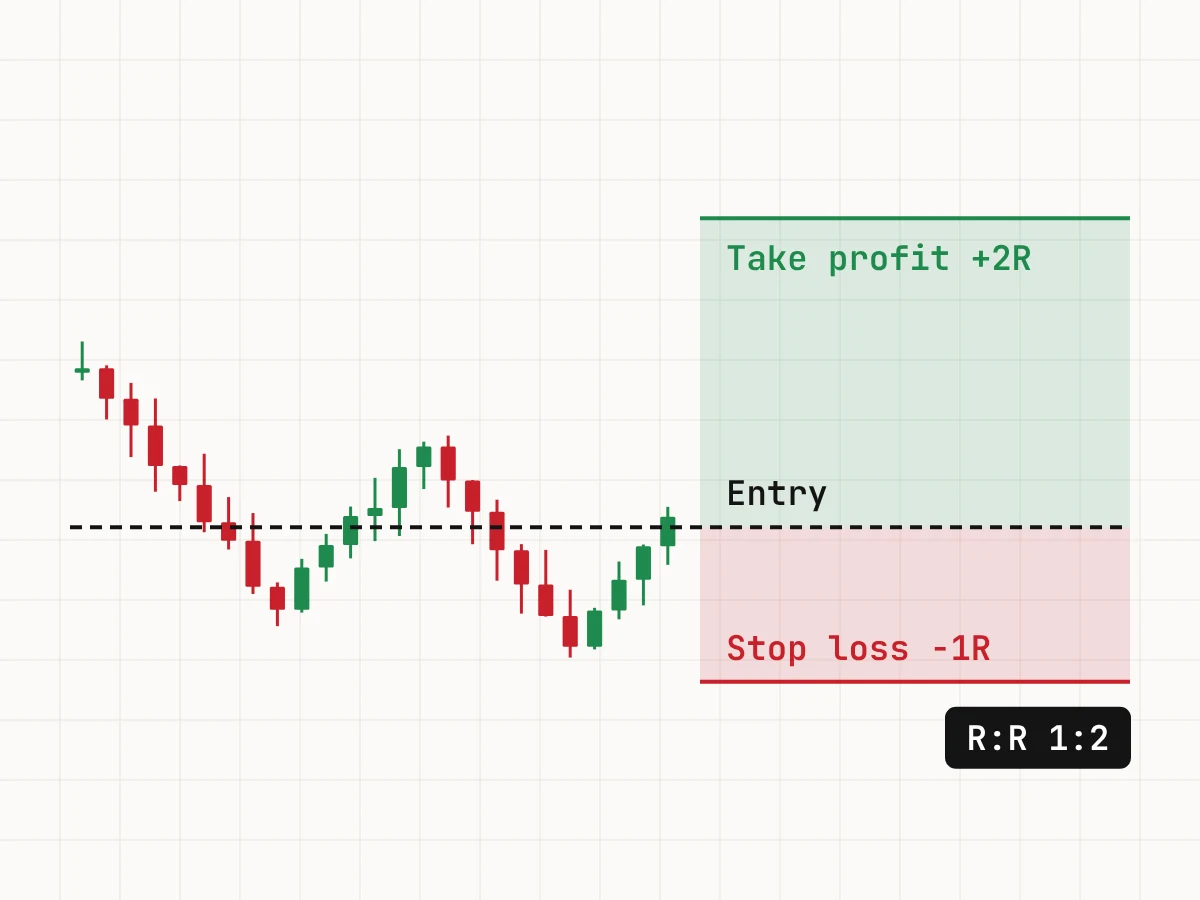
- Stop: for example, a few pips beyond the swing low or the support zone.
- Target: for example, just before the next resistance zone, with a minimum of 1:2 reward-to-risk. If the next zone is closer than that, there is no trade.
- Management: whether you take partial profits, and when, if ever, you move the stop.
The stop loss and take profit guide explains how to place each of these from the chart.
Risk per trade and loss limits
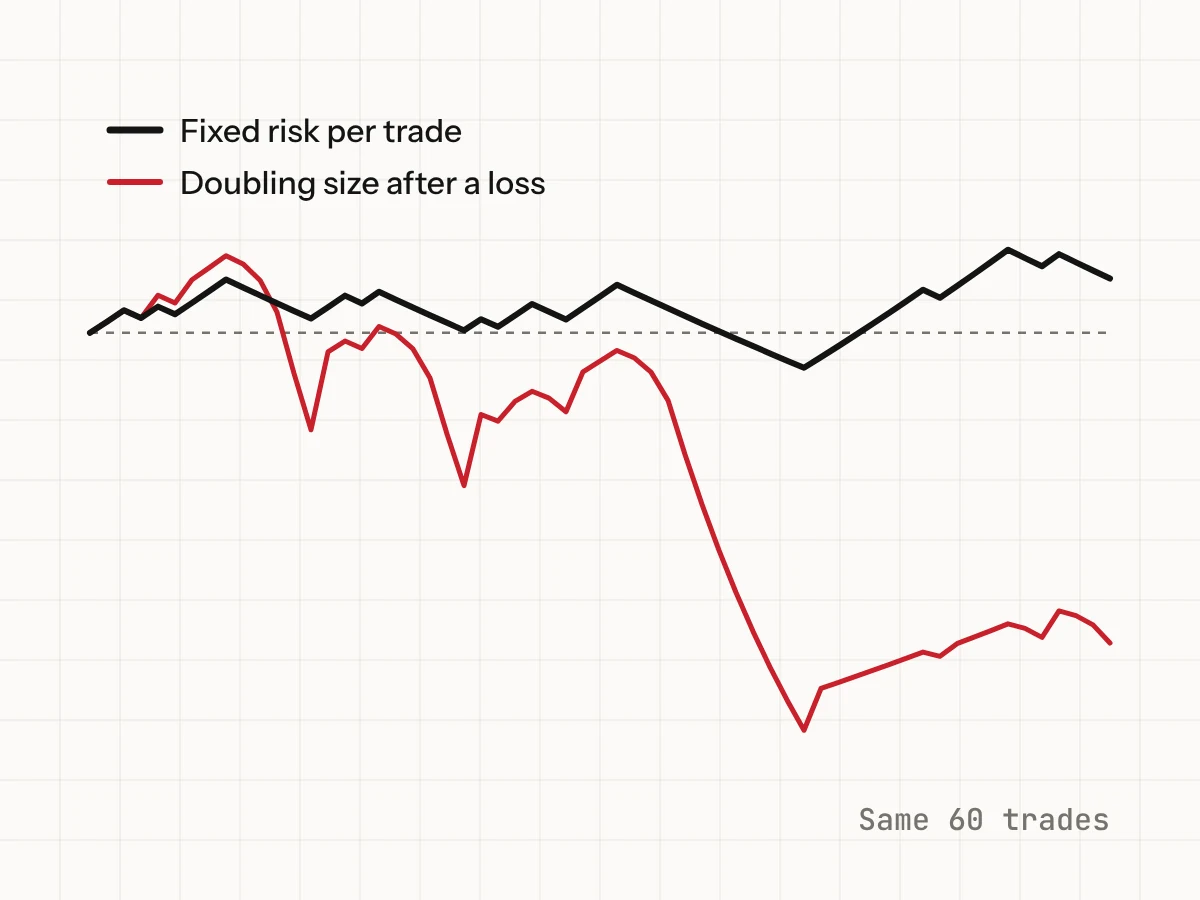
Fix the risk per trade as a percentage of equity, and set daily and weekly loss limits. When you hit a limit, you stop trading until the next day or week. These numbers decide how long you survive a bad run.
On a $10,000 account, a 1% risk per trade is $100. A daily limit of 2% is $200, two full losses. A weekly limit of 5% is $500. With a 25-pip stop on EUR/USD, the position size is $100 ÷ (25 × $10) = 0.40 lots. After two losses, equity is $9,800 and 1% is now $98, so the size shrinks with the account.
Also limit how much risk you hold at once. Buying EUR/USD and GBP/USD at the same time is often close to one bigger bet on a weaker dollar, so count related trades together.
Pre-trade checklist
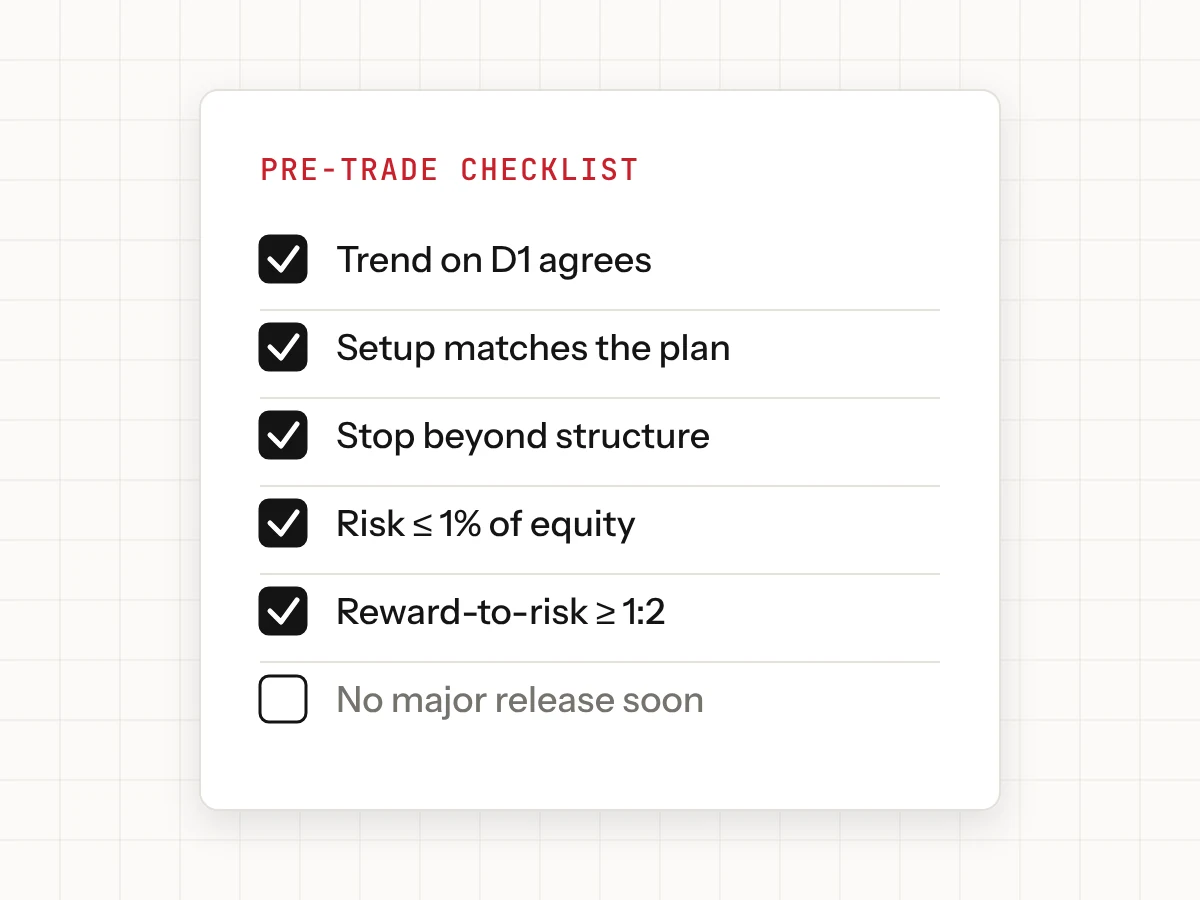
Run the same checklist before every trade. If any answer is no, there is no trade.
- The market and the time are in my plan.
- The setup matches my written definition on my chosen timeframes.
- No major economic release is due before the trade is likely to finish, or I have accepted that risk.
- The stop is beyond structure and I know its distance in pips or points.
- The target is before the next opposing level and gives at least 1:2.
- The position size risks 1% of equity or less.
- I am inside my daily and weekly loss limits.
- I am calm, not chasing a missed move or trying to win back a loss.
Keep a trading journal
A journal turns your trades into data you can learn from. Record every trade, including the ones that break your rules:
- Date, time, market and direction.
- Setup name and timeframes.
- Entry, stop, target, position size and money at risk.
- Exit price, result in dollars and result in R (the result divided by the amount risked).
- A screenshot of the chart at entry and at exit.
- Whether you followed the plan, and if not, which rule you broke.
- How you felt before and after the trade, in a few words.
Fill it in right after each trade, while you still remember why you acted.
Review monthly and test on demo
Once a month, calculate a few simple numbers from your journal. Win rate is wins divided by total trades. Average R is the total of all results in R divided by the number of trades. Expectancy is the average result per trade: win rate × average win − loss rate × average loss.
In one month you take 20 trades: 8 wins and 12 losses. Win rate = 8 ÷ 20 = 40%, so the loss rate is 60%. The average win is $190 and the average loss is $100. Expectancy = 0.40 × $190 − 0.60 × $100 = $76 − $60 = $16 per trade, or 20 × $16 = $320 for the month. With $100 risked per trade, that is 0.16R per trade, the same as the average R. If the average win had been $140, expectancy would be 0.40 × $140 − 0.60 × $100 = $56 − $60 = −$4 per trade: a losing plan with the same win rate.
Twenty trades is a small sample, so look for patterns over 50 to 100 trades before you make big changes, and change one rule at a time. Check how many trades broke the plan. If those trades lost more than the others, the fix is discipline, not a new setup.
Test every new plan on a demo account first, for at least 30 to 50 trades. The free demo comes with up to $100,000 in virtual funds, but size your trades as if the account held what you actually plan to deposit, so your journal reflects real numbers. You can open a free demo account to start.
Key takeaways
- Define your markets, hours and setups precisely enough that someone else could find the same trades.
- Fix risk per trade and daily and weekly loss limits before you start.
- Run the pre-trade checklist every time; any no means no trade.
- Journal every trade and review win rate, average R and expectancy each month.
- Test the plan on a demo account before you use real money.
This lesson is general education, not investment advice. Examples use illustrative numbers. CFDs are complex instruments and come with a high risk of losing money rapidly due to leverage.