Place the stop where your idea is wrong
A stop loss belongs at the price that proves your trade idea wrong. For a buy, that is usually just below the last swing low or below a support zone. For a sell, it is just above the last swing high or a resistance zone. Add a small buffer for the spread and normal noise.
Avoid a fixed round number of pips, such as 20 pips on every trade. A fixed stop ignores the chart: on a quiet day it may be wider than needed, and on a busy day it may sit inside normal swings. Also avoid placing it exactly on an obvious round price, where many other stops are likely to sit.
You plan to buy EUR/USD at 1.08500. The last H1 swing low is 1.08320, so you place the stop 5 pips below it, at 1.08270. The stop distance is 1.08500 − 1.08270 = 0.00230, or 23 pips. If you risk $100, the position size is $100 ÷ (23 × $10) ≈ 0.43 lots. At 0.43 lots, a full stop costs 23 × $4.30 = $98.90.
First the stop from the chart, then the size from the stop. The risk and position size guide shows the formula.
Match the stop to volatility
Volatility changes from day to day. The Average True Range (ATR) shows the average size of recent candles, usually over 14 periods, including gaps between candles. It does not tell you direction, only how much price typically moves.
Use ATR as a check, not as the stop itself. Place the stop beyond structure first, then compare its distance with the ATR of the timeframe you trade. Many traders want the stop at least 1 to 1.5 × ATR from the entry. If the structure stop is closer than that, find a clearer level or skip the trade. If it is much wider, your position size will simply be smaller for the same dollar risk.
EUR/USD H1 ATR(14) is 15 pips. The 23-pip stop above is 23 ÷ 15 ≈ 1.5 × ATR, outside a typical hourly swing. A 6-pip stop would be 6 ÷ 15 = 0.4 × ATR, small enough for one ordinary candle to hit it. If ATR doubles to 30 pips and you double the stop to 46 pips, halve the position size to keep the same dollar risk.
Reward-to-risk and the break-even win rate
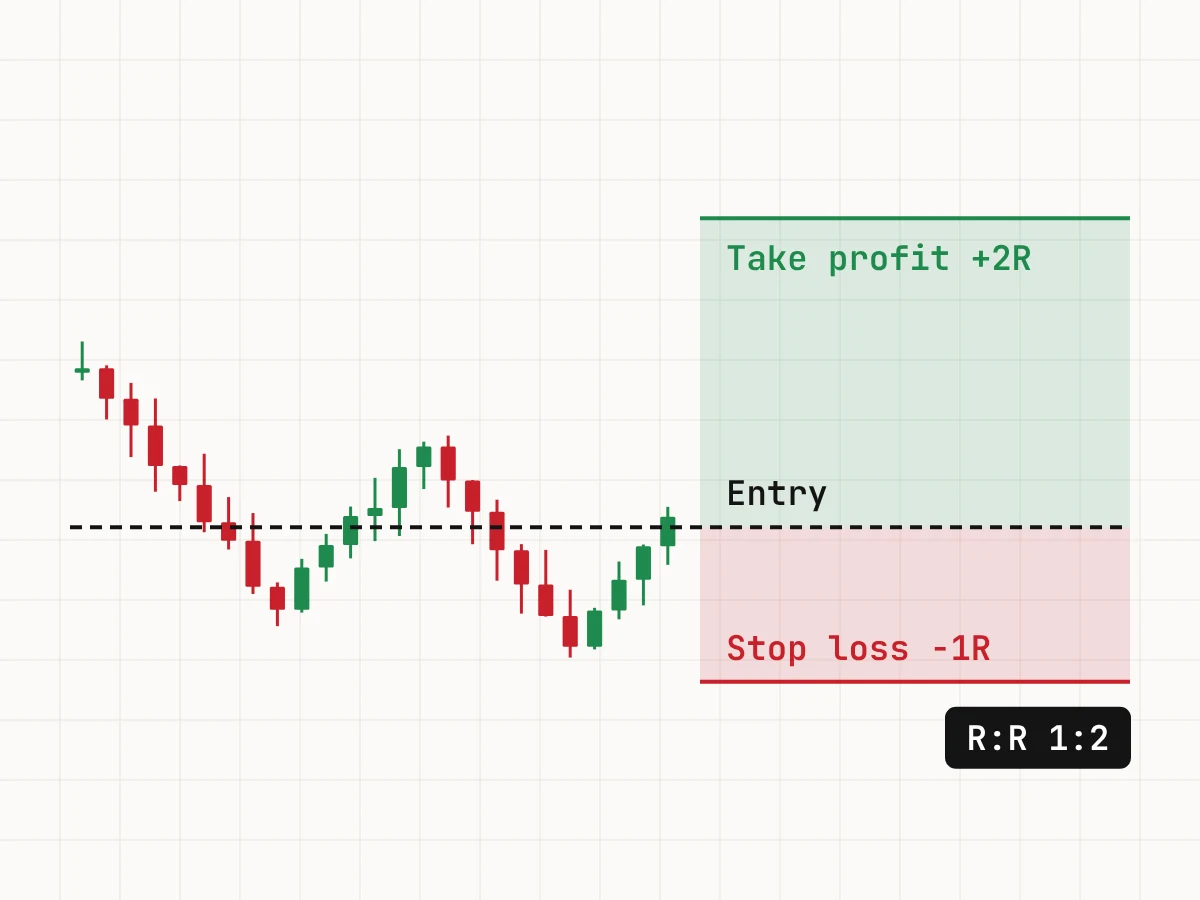
Reward-to-risk (R) compares the distance to your target with the distance to your stop. A 1:2 trade aims to make twice what it risks. The higher the R, the fewer trades you need to win to break even:
- Break-even win rate = 1 ÷ (1 + R), before costs.
- 1:1 → 1 ÷ 2 = 50%
- 1:1.5 → 1 ÷ 2.5 = 40%
- 1:2 → 1 ÷ 3 ≈ 33.3%
- 1:3 → 1 ÷ 4 = 25%
You risk $100 per trade at 1:2, so a win pays $200 and a loss costs $100. Over 10 trades with 4 wins and 6 losses: 4 × $200 − 6 × $100 = $800 − $600 = +$200. With 3 wins and 7 losses: 3 × $200 − 7 × $100 = $600 − $700 = −$100. The break-even point is about 3.3 wins in 10, and spreads and commissions push it a little higher.
A higher R is not automatically better. Distant targets are reached less often, so the win rate usually falls as R rises. What counts is your real win rate at your real R over many trades.
Set the target at the next level
Place the take profit just before the next level where opposing orders are likely: the next resistance zone for a buy, the next support zone for a sell. Then check the R. If the next level is too close to give your minimum R, skip the trade rather than stretching the target past the level.
Using the buy at 1.08500 with a stop at 1.08270 (23 pips): the next H1 resistance zone starts at 1.08980, so you set the target slightly below it at 1.08960. The target distance is 1.08960 − 1.08500 = 0.00460, or 46 pips, and R = 46 ÷ 23 = 2, a 1:2 trade. If resistance had started at 1.08700, the target would be about 18 pips, or 18 ÷ 23 ≈ 0.8R, and the trade would fail a 1:2 rule.
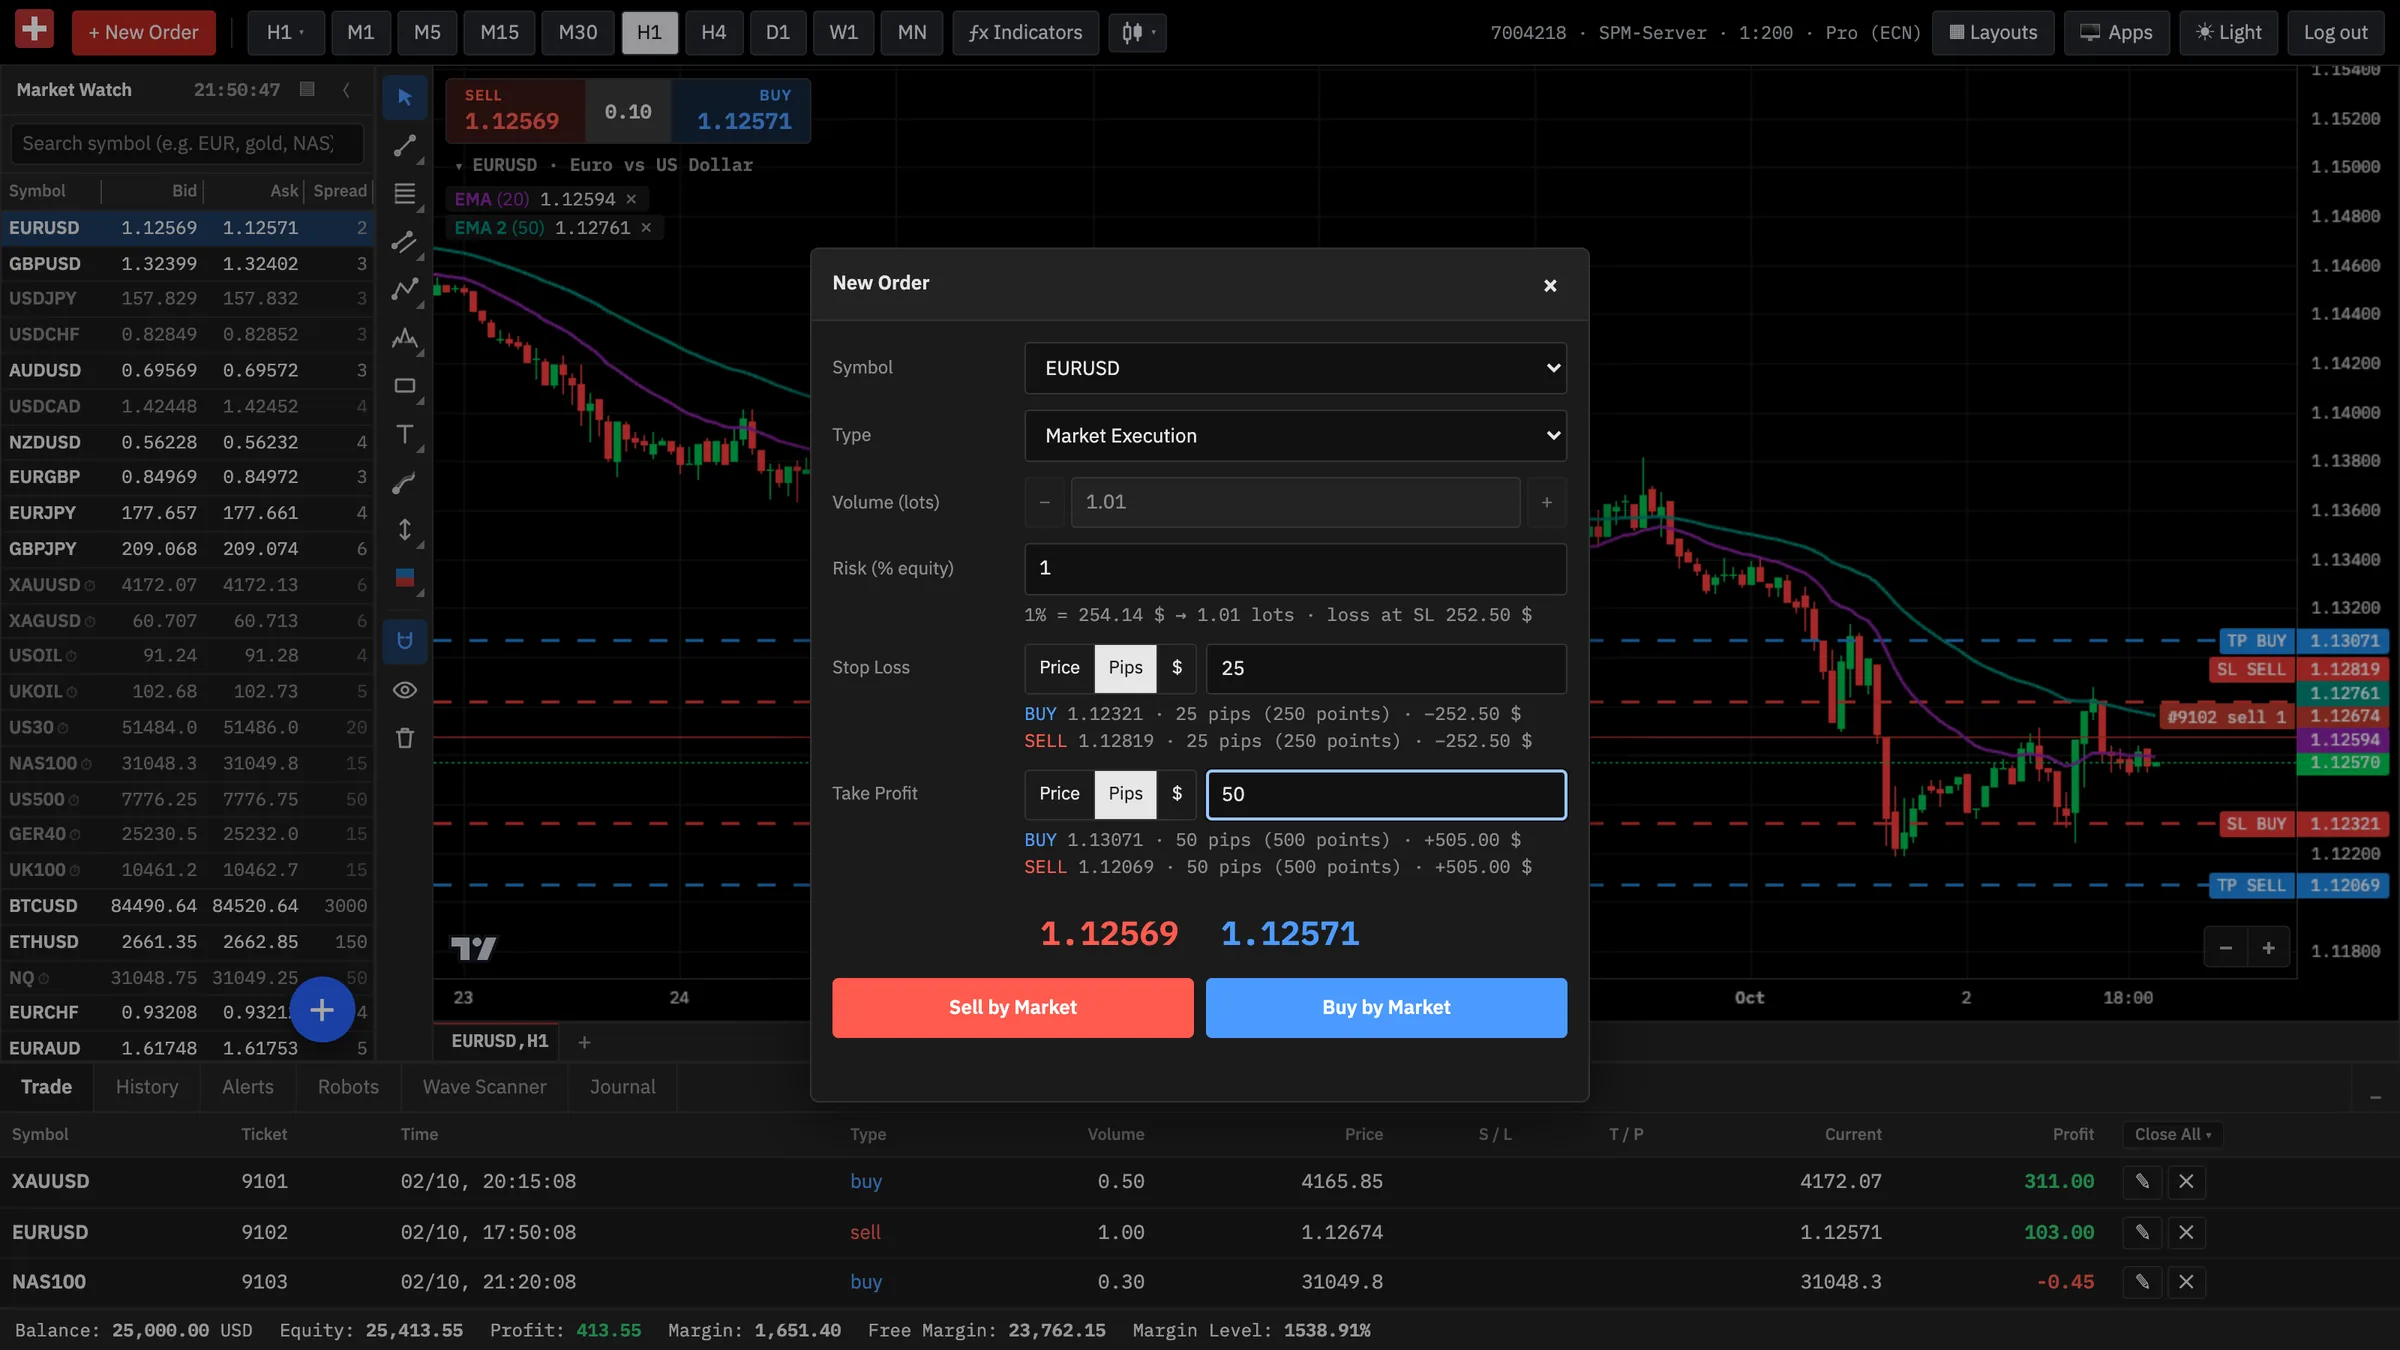
In SPM Trader’s order ticket you can set the stop loss and take profit in price, pips or dollars. You can also enter your risk in the Risk (% equity) field, and the platform calculates the lot size before you click Sell by Market or Buy by Market.
Partial exits and break-even stops
A partial exit closes part of the position at a first target and lets the rest run to the main target. Moving the stop to break-even means moving it to your entry price once the trade has moved in your favor. Both feel safe, and both have a cost.
You buy 1.00 lot of EUR/USD with a 20-pip stop, risking $200. You close 0.50 lot at +20 pips (1R) for 20 × $5 = $100, and target +40 pips (2R) with the rest for another 40 × $5 = $200. If both hit, you make $300, compared with 40 × $10 = $400 by holding the full lot. If the rest is stopped at the original stop, the result is $100 − $100 = $0. If the stop is hit before the first target, you lose the full $200.
- Pro: both lower the chance that a trade that was in profit ends as a full loss.
- Con: partial exits shrink your average win, which raises the win rate you need to break even.
- Con: a stop at break-even is often hit by a normal pullback just before price moves on to the target.
- Con: a break-even exit is rarely exactly zero once spreads and commissions are counted.
Decide in writing whether and when you use either technique. Moving a stop because you feel nervous is not a plan.
A stop is not a guaranteed price
When price reaches your stop, it becomes a market order and fills at the next available price. In fast markets, such as around major news, or when the market gaps at the weekly open, that price can be worse than your stop. This is called slippage. It can also work in your favor, but plan for the bad side.
You sell GBP/USD at 1.27000 with a stop at 1.27300, a 30-pip risk. Over the weekend, news moves the market and it opens on Monday at 1.27650. Your stop fills near 1.27650, a loss of 1.27650 − 1.27000 = 0.00650, or 65 pips. At 0.50 lot, that is 65 × $5 = $325 instead of the planned 30 × $5 = $150.
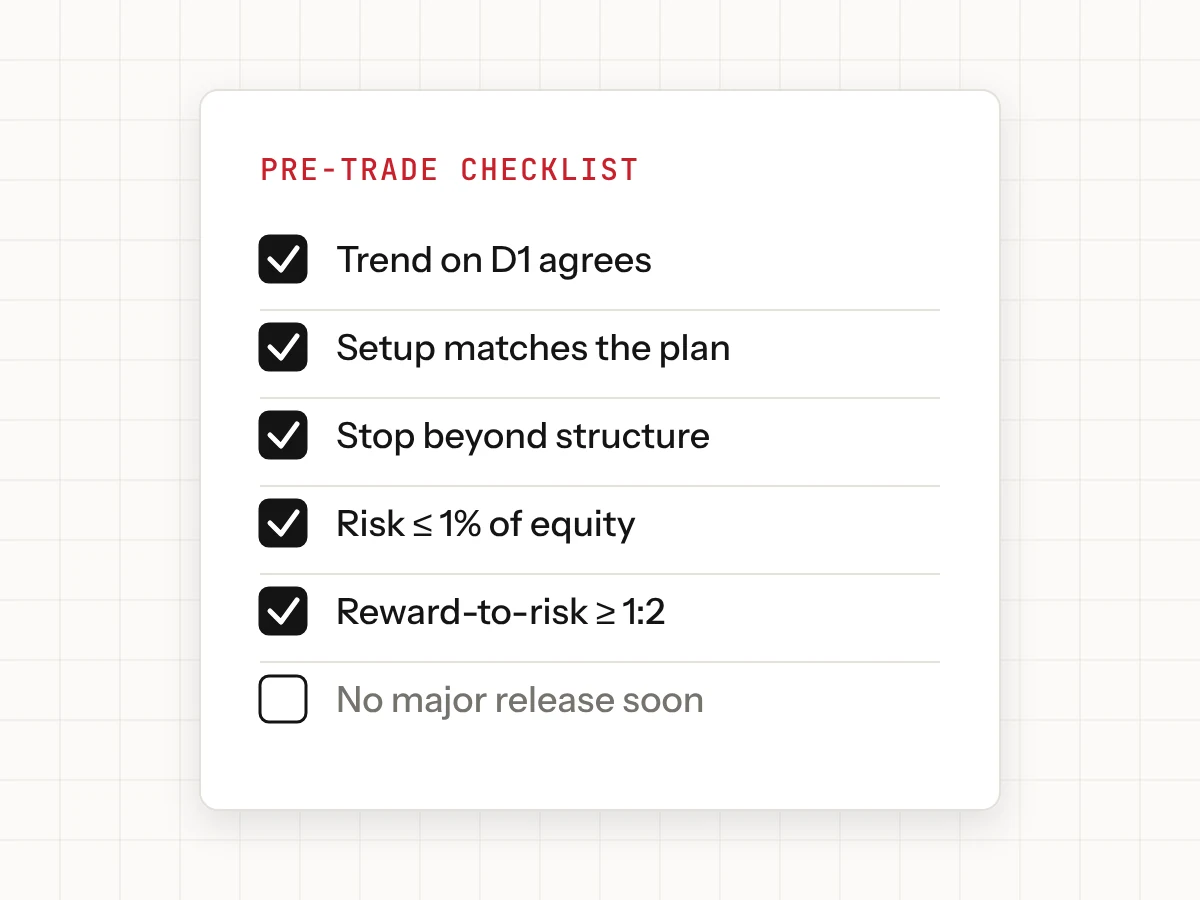
Check the calendar of economic releases before you enter, and decide whether to reduce size or stay out before major news and weekends. Then practice placing stops and targets without risk when you open a free demo account.
Key takeaways
- Place the stop where your idea is wrong, beyond structure, then size the position from it.
- Use ATR to check that your stop sits outside normal noise.
- Break-even win rate = 1 ÷ (1 + R): about 33.3% at 1:2, before costs.
- Set the target before the next opposing level, and skip trades that do not offer your minimum R.
- A stop limits losses under normal conditions, but gaps and fast markets can fill it at a worse price.
This lesson is general education, not investment advice. Examples use illustrative numbers. CFDs are complex instruments and come with a high risk of losing money rapidly due to leverage.