Reading the economic calendar
An economic calendar lists scheduled data releases and central bank decisions. Each line usually shows these fields.
- Time: when the number is published. Set the calendar to your time zone.
- Country or currency: which economy it covers, and so which markets it may move.
- Impact: the provider’s estimate of how much the release tends to move prices, usually low, medium or high.
- Previous: the last reading, sometimes revised when the new one comes out.
- Forecast or consensus: the typical expectation of economists surveyed beforehand.
- Actual: the number itself, filled in at release.
US clocks change on the second Sunday of March and the first Sunday of November. Europe changes on the last Sunday of March and of October. For a few weeks each year, the gap between New York and European time is one hour shorter than usual, so check release times again in those weeks.
Releases that move markets most
Dozens of numbers come out every week, but a handful cause most of the large moves.
- Central bank rate decisions: the US Federal Reserve’s FOMC holds eight scheduled meetings a year and publishes its statement at 2:00 p.m. New York time, with a press conference 30 minutes later. The ECB sets euro area rates about every six weeks. The decision and the press conference can move prices in different directions.
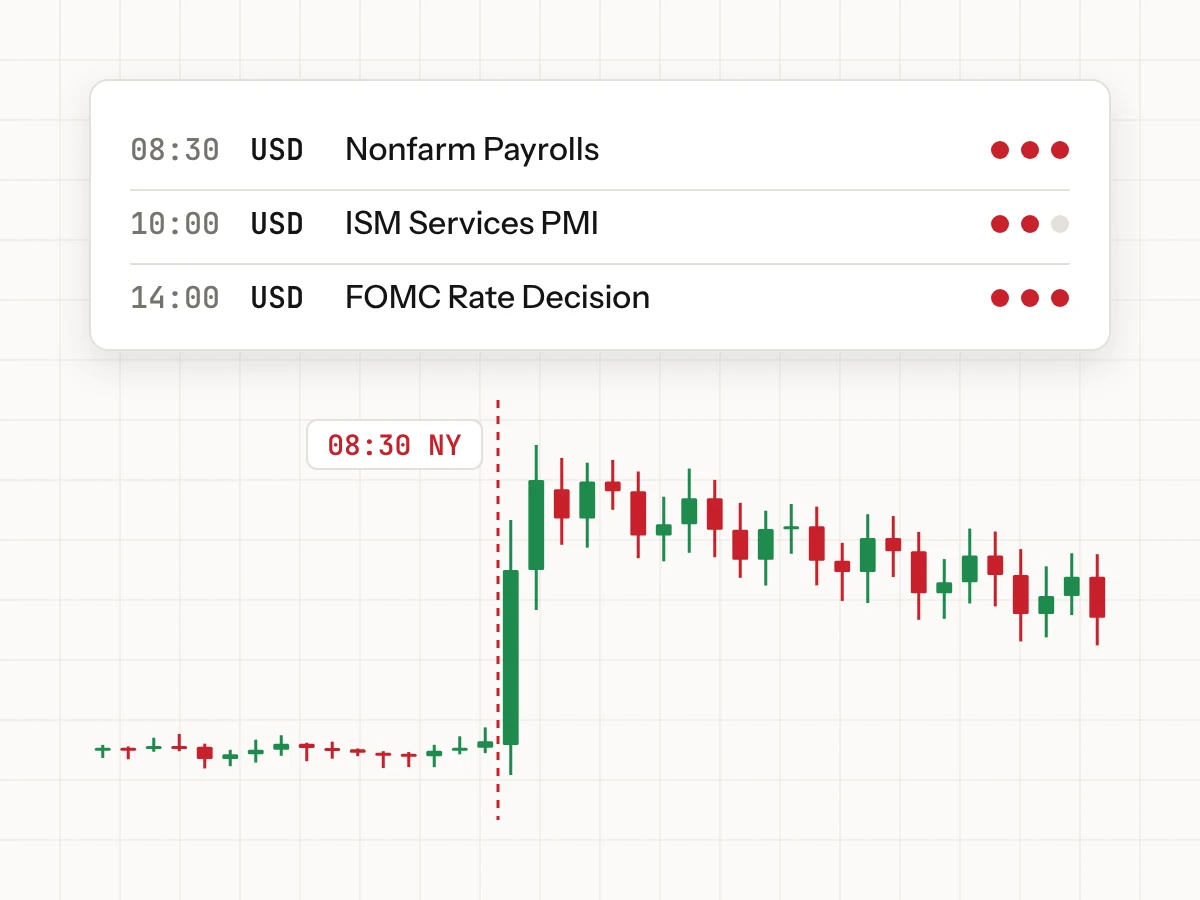
- CPI (inflation): US consumer prices are released at 8:30 a.m. New York time, usually around the middle of the month. Traders watch the headline figure and core CPI, which excludes food and energy.
- US nonfarm payrolls: part of the monthly employment report, usually published on the first Friday of the month at 8:30 a.m. New York time, together with the unemployment rate and average hourly earnings.
- GDP: the broadest measure of growth, published quarterly. In the US, a first estimate is followed by revisions, and the first usually draws the biggest reaction.
- PMIs: monthly surveys of purchasing managers. A reading above 50 points to expansion and below 50 to contraction. Flash PMIs come out before the month ends.
Which release matters most changes over time. When inflation is the market’s main worry, CPI can outweigh payrolls. For the bigger picture, see What moves currency prices.
Surprise versus consensus
Prices react mostly to the surprise: the difference between the actual number and the consensus. What the market expected is usually already in the price. A strong number that was expected to be even stronger can push a currency down.
The consensus for nonfarm payrolls is 180,000 new jobs. The actual comes in at 120,000, a miss of 180,000 − 120,000 = 60,000. In the same report, the previous month is revised down from 200,000 to 170,000, and average hourly earnings rise 0.4% against 0.3% expected. The jobs figures are weak, the wage figure is strong. The first move can go one way and reverse within minutes as traders weigh all three.
This is why predicting direction from the headline alone is unreliable. Positioning, revisions and the details of the report all shape the reaction. Treat the first move as information, not a promise.
Spreads, liquidity, slippage and gaps
Around a high-impact release, many liquidity providers widen their quotes or step back. Spreads widen, for example from 1 pip to 5 pips or more, and price can jump several levels at once. This affects you even if you do nothing.
- A wider spread raises the cost of entering. On many platforms the chart shows the bid, while a short position closes at the ask, so a wider spread can trigger a short trade’s stop even if the chart never reached it.
- A triggered stop loss becomes a market order and fills at the next available price. In a fast market that can be well past your level. This is slippage.
- If price jumps over your stop with no trading in between, it is a gap, and you are filled at the first price after it.
- Pending buy stop and sell stop entry orders can fill with slippage too.
You are long EUR/USD with 0.5 lots at 1.08450 and a stop at 1.08200. That is 25 pips × $5 per pip = $125 of planned risk. When the release hits, price drops from 1.08260 to 1.08050 with no trades in between, and the stop fills at 1.08050. The loss is 40 pips × $5 = $200, which is $75 more than you planned.
Stops still matter around news: they limit the loss even when they slip. See Using stop loss and take profit.
Three ways to handle a release
Decide your approach before the release, not during it. Most traders use one of these three.
- Stay flat: close positions or avoid opening new ones from, for example, 15 minutes before to 15 minutes after a high-impact release. It costs nothing except missed moves.
- Trade the reaction after the first minutes: wait, for example, 5 to 15 minutes until spreads return to normal. Use the high and low of the first spike as reference levels, enter on a clear break or retest, and place your stop beyond the spike. The first move can still reverse.
- Hold through with smaller size: for longer-term trades, size the position so that a stop filled well past its level is still an acceptable loss.
On a $10,000 account, you normally risk 1% ($100) with a 25-pip stop on EUR/USD: 100 ÷ (25 × $10) = 0.4 lots. To hold through payrolls, you assume the stop could fill 25 pips worse and size for 50 pips: 100 ÷ (50 × $10) = 0.2 lots. A normal stop now costs $50, and a fill 25 pips past the stop costs $100. If the release goes your way, the gain is also half what it would have been.
A pre-release checklist
Run through this list each week and again before each high-impact release.
- Check the calendar for high-impact events in the currencies and indices you trade.
- Convert the release times to your time zone.
- Note the previous reading and the consensus.
- Choose your approach for each event: stay flat, trade the reaction or hold with smaller size.
- List the open positions and pending orders the release could affect. US data can move EUR/USD, gold and US indices at once.
- Check your margin level. A spike plus wider spreads can push it down quickly.
- Do not remove stops or widen them just before the release.
- After the release, wait for spreads to return to normal before placing new orders, and note what happened in your journal.
To see these effects without risking money, open a free demo account and watch a few releases. Note how far spreads widen, how fast they return to normal and how far price travels in the first minutes.
Key takeaways
- Prices react to the surprise against consensus, not to whether a number looks good or bad.
- Rate decisions, CPI, nonfarm payrolls, GDP and PMIs cause most of the large moves.
- Around releases, spreads widen and stops can fill well past their level.
- Choose in advance: stay flat, trade the reaction after the first minutes or hold through with smaller size.
This lesson is general education, not investment advice. Examples use illustrative numbers. CFDs are complex instruments and come with a high risk of losing money rapidly due to leverage.