Market orders, limit orders and who moves price
A limit order waits at a price you choose or better. Resting limit orders form the order book. The highest resting buy is the bid, and the lowest resting sell is the offer, also called the ask. A market order does not wait: it trades at once against the best resting limit orders.
- A buyer using a market order lifts the offer: they pay the ask price. This is an aggressive buyer.
- A seller using a market order hits the bid: they accept the bid price. This is an aggressive seller.
- Every trade has a buyer and a seller. The aggressor is the side that crossed the spread.
Price rises when aggressive buyers take all the offers at one price and the next trade happens a level higher. It falls when aggressive sellers use up the bids. Keep one difference in mind: an executed trade is a fact, while a resting limit order is only an intention and can be canceled at any moment.
What order flow bubbles show, and what they miss
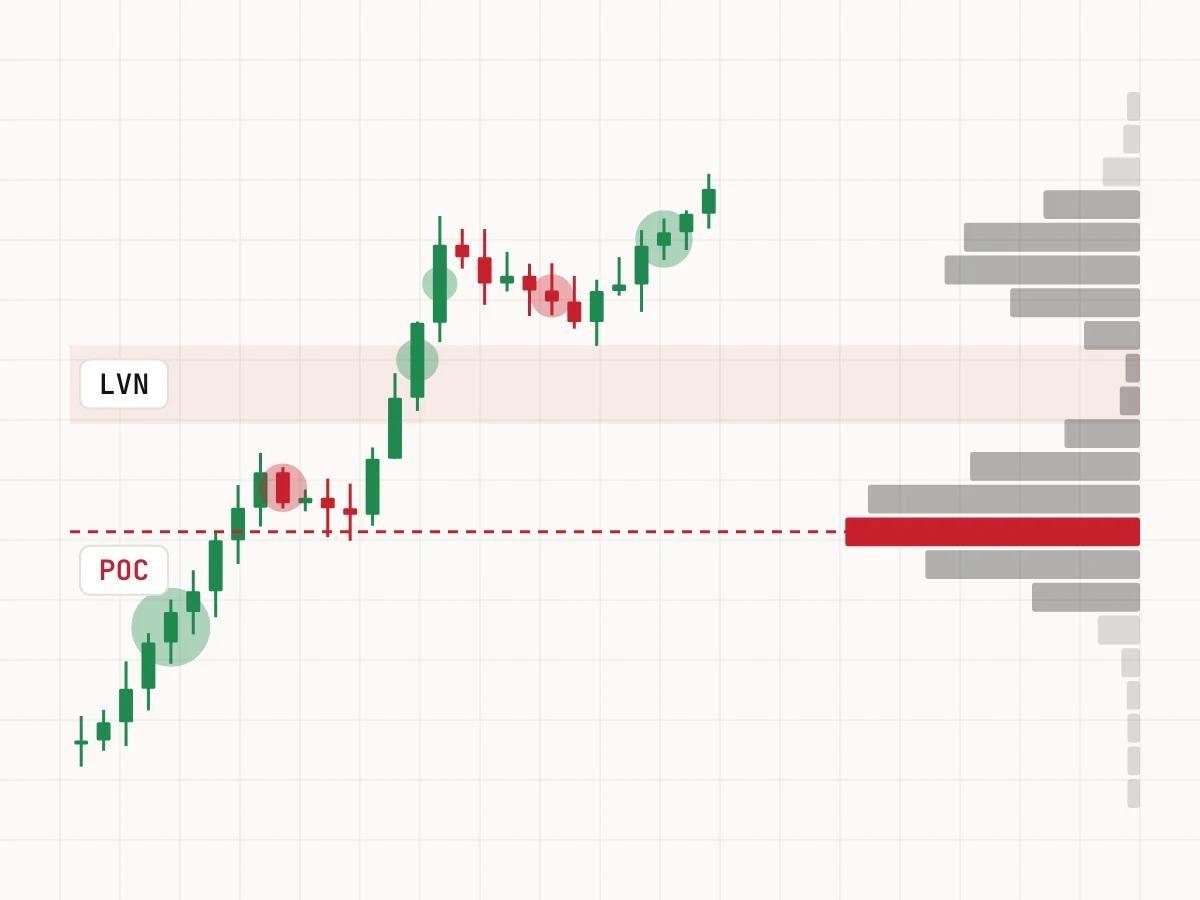
An order flow bubble chart plots large executed trades on the price chart. Each bubble sits at the price and time of the trade, its color shows which side was the aggressor, and its size reflects the value of the trade.
A market buy of 5 BTC at $60,000 has a value of 5 × $60,000 = $300,000. On a bubble chart it appears as a buy bubble at 60,000, larger than the bubbles of smaller trades around it.
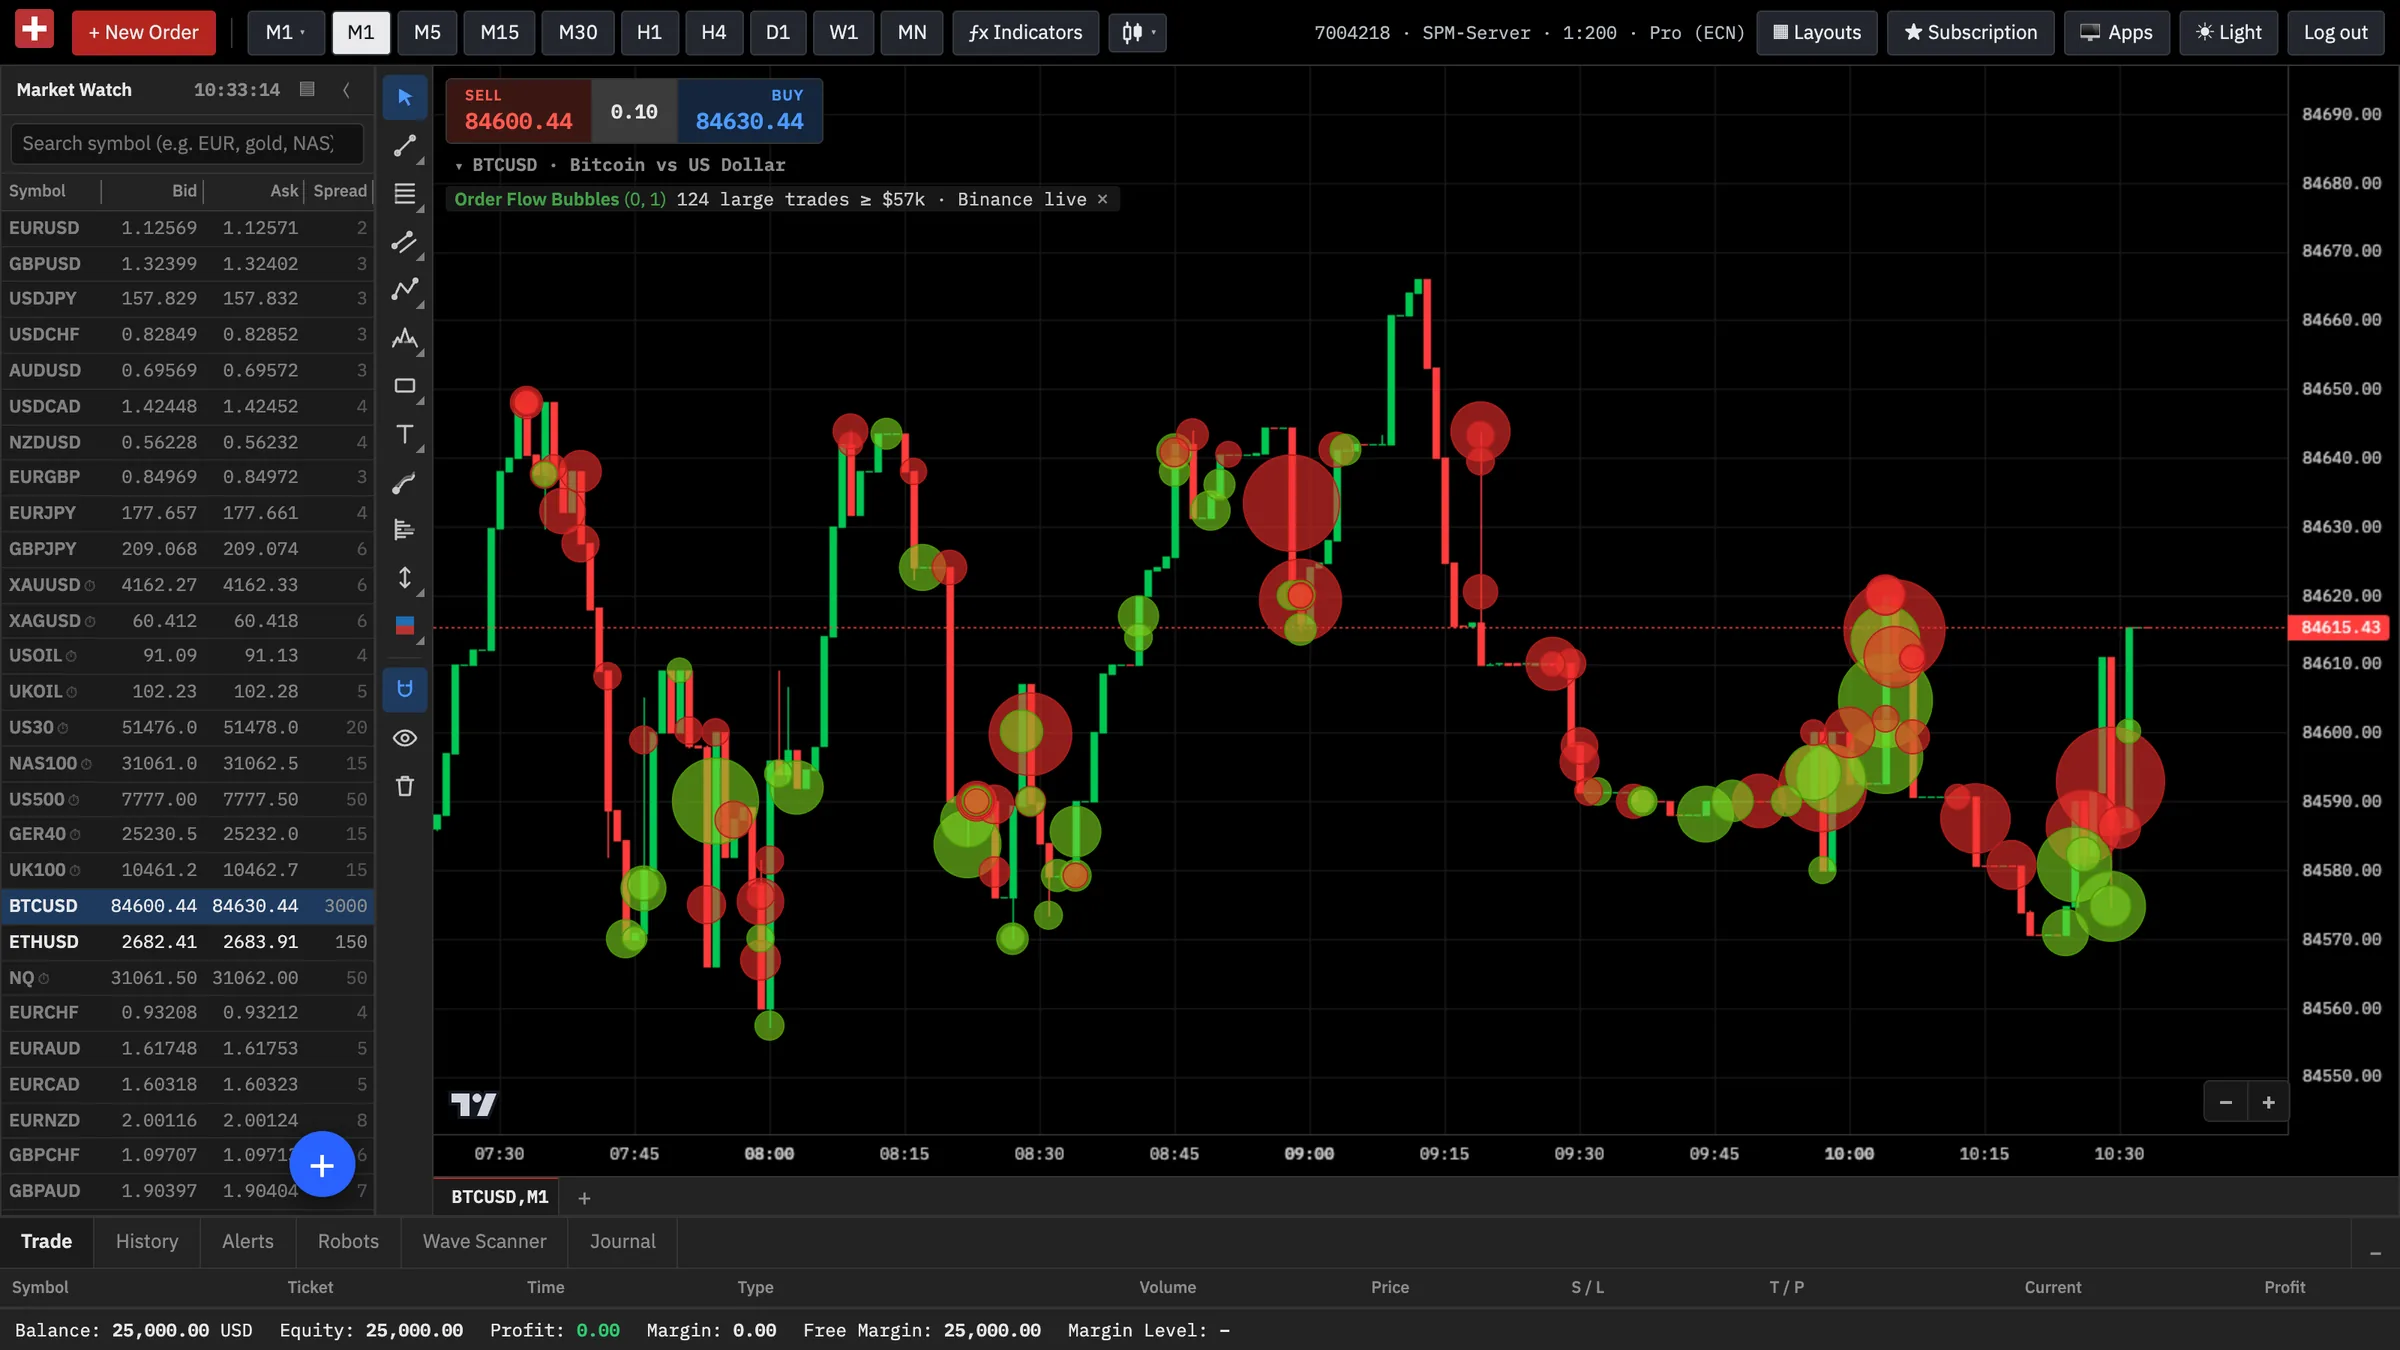
Bubbles are useful, but they have clear limits:
- A large market buy does not reveal intent. It may be someone closing a short, hedging a position elsewhere or buying on one exchange while selling on another.
- Heavy aggressive buying that fails to lift price can mean absorption: a seller with large limit orders is taking all of it. Big buyers do not guarantee higher prices.
- Bubbles show executed trades only. Limit orders still resting in the book, or canceled before they traded, never appear.
- Data from one venue is a sample of the market, not the whole market.
Know where the data comes from. In SPM Trader, where order flow is one of the premium tools, crypto order flow comes from Binance trades. For futures, the Nasdaq 100 and the S&P 500, it comes from Hyperliquid perpetual markets, aligned to the futures price. It is not CME exchange data, so on those instruments the bubbles show activity on Hyperliquid, not on the main futures exchange. Spot forex trades over the counter with no central exchange, so there is no complete record of every forex trade anywhere.
Volume profile: POC, value area and volume nodes
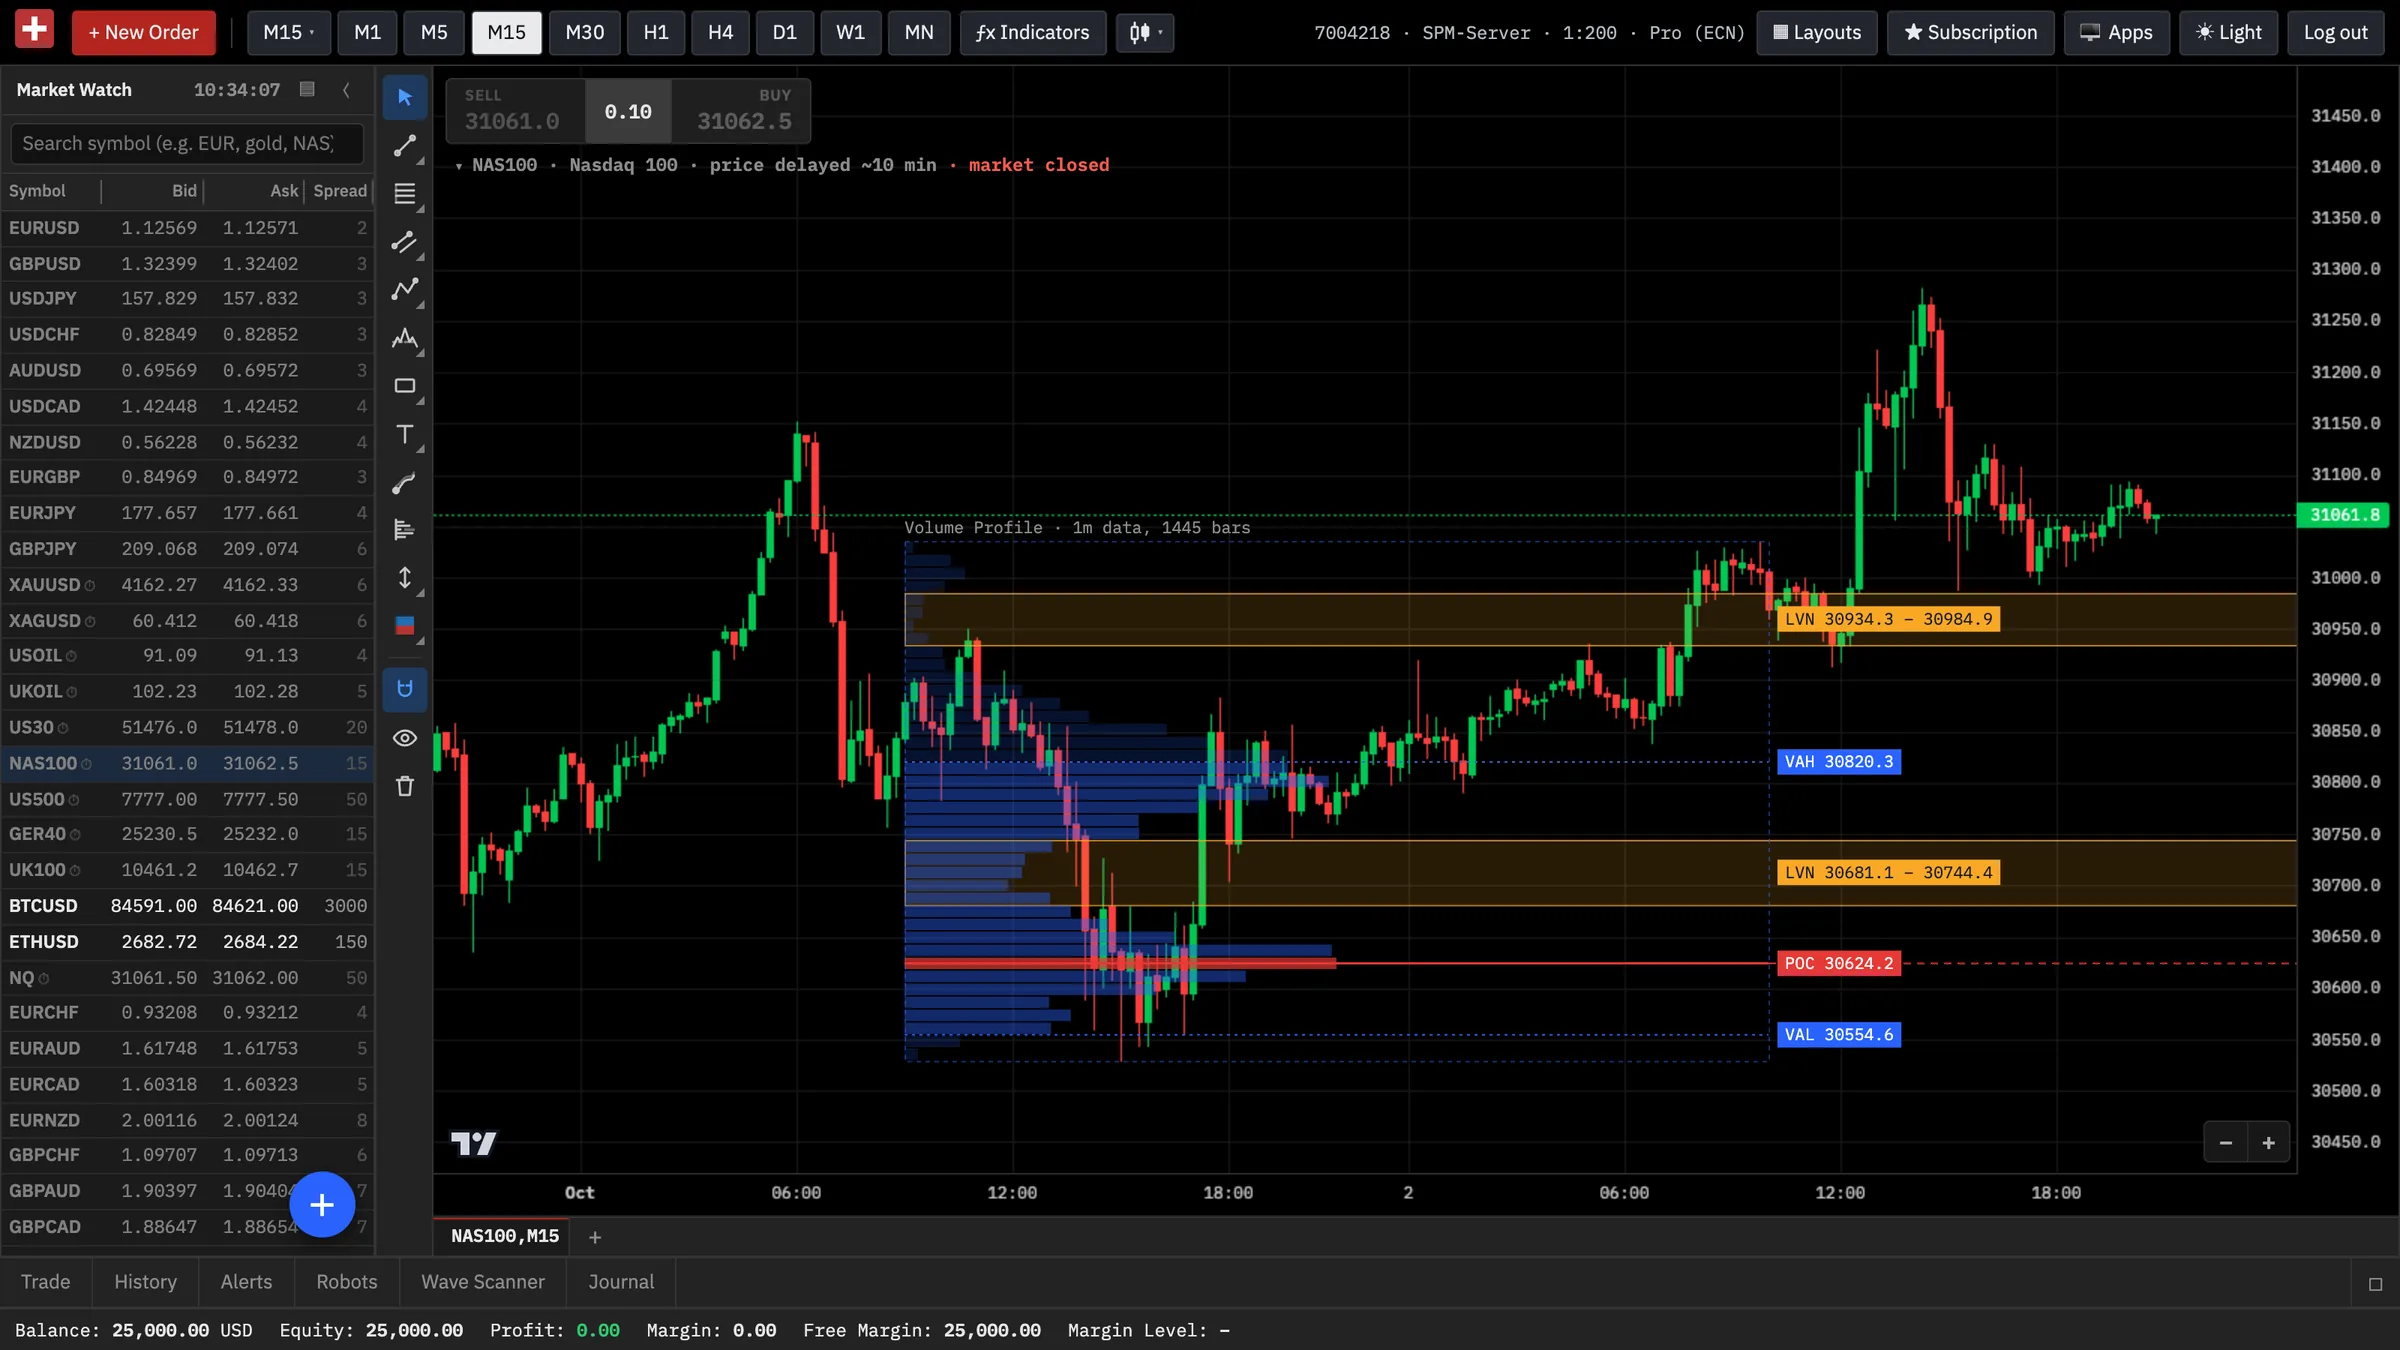
A volume profile is a horizontal histogram of how much volume traded at each price over a chosen period or move. Instead of asking when volume happened, it asks where.
- Point of control (POC): the price with the most volume in the range.
- Value area: the band of prices around the POC that holds about 70% of the volume. Its upper edge is the value area high and its lower edge the value area low.
- High-volume node (HVN): a cluster of prices with heavy trading.
- Low-volume node (LVN): a thin area with little trading.
A move’s profile shows 50,000 contracts traded in total. The value area is the band around the POC that holds about 70% of them: 50,000 × 0.70 = 35,000 contracts.
HVNs mark prices both sides accepted. When price returns, many traders hold positions there, so price tends to slow down and move sideways. LVNs mark prices the market passed through quickly, with little business done. Price often moves fast through them again, and their edges often act as turning points.
On many forex charts, volume is tick volume, a count of price changes rather than traded contracts. It can still show where activity was heavier, but treat it as an approximation.
Combining them with structure and risk
Neither tool is a trading signal. Use them to choose where to act, confirm with market structure, then size the trade from the stop. Structure means the trend and its swing highs and lows, covered in How to read price charts.
- Define the trend and the key swing points.
- Draw a volume profile over the last clear move and mark the POC, the value area and any LVNs.
- Wait for price to reach one of those levels. Do not chase it in between.
- Watch the order flow for evidence, for example heavy aggressive selling into the level that fails to push price lower.
- Place the stop beyond the point where the idea is wrong, outside the LVN or past the swing, not inside it.
- Size the position from the stop distance, as shown in Managing risk and position size.
A Nasdaq 100 rally runs from 18,100 to 18,400. Its profile shows the POC at 18,350 and an LVN between 18,240 and 18,260. Price pulls back to the top edge of the LVN and aggressive selling there fails to push it lower. You buy at 18,265 with a stop at 18,230, a risk of 35 points, and a target at the POC, 18,350, a potential gain of 85 points. Reward-to-risk is 85 ÷ 35 ≈ 2.4. If price breaks through the LVN instead, it can move fast toward the next heavy area, and the stop closes the trade for a 35-point loss plus any slippage.
On the SPM Trader order ticket, you can enter your risk in the Risk (% equity) field together with the stop loss, and the platform calculates the lot size before you click. The dollar value of each index point depends on the contract specification, so check it before you trade.
Practice first. Open a free demo account, mark the POC, value area and LVNs before the session starts, and review afterward which levels held and which did not.
Key takeaways
- Market orders move price by taking resting limit orders. The aggressor is the side that crossed the spread.
- Large-order bubbles show executed trades from one data source, not intent and not the whole market.
- The POC is the busiest price, and the value area holds about 70% of the volume.
- Price tends to slow at high-volume nodes and move fast through low-volume nodes.
- Use both tools to choose locations, confirm with structure and size every trade from the stop.
This lesson is general education, not investment advice. Examples use illustrative numbers. CFDs are complex instruments and come with a high risk of losing money rapidly due to leverage.